
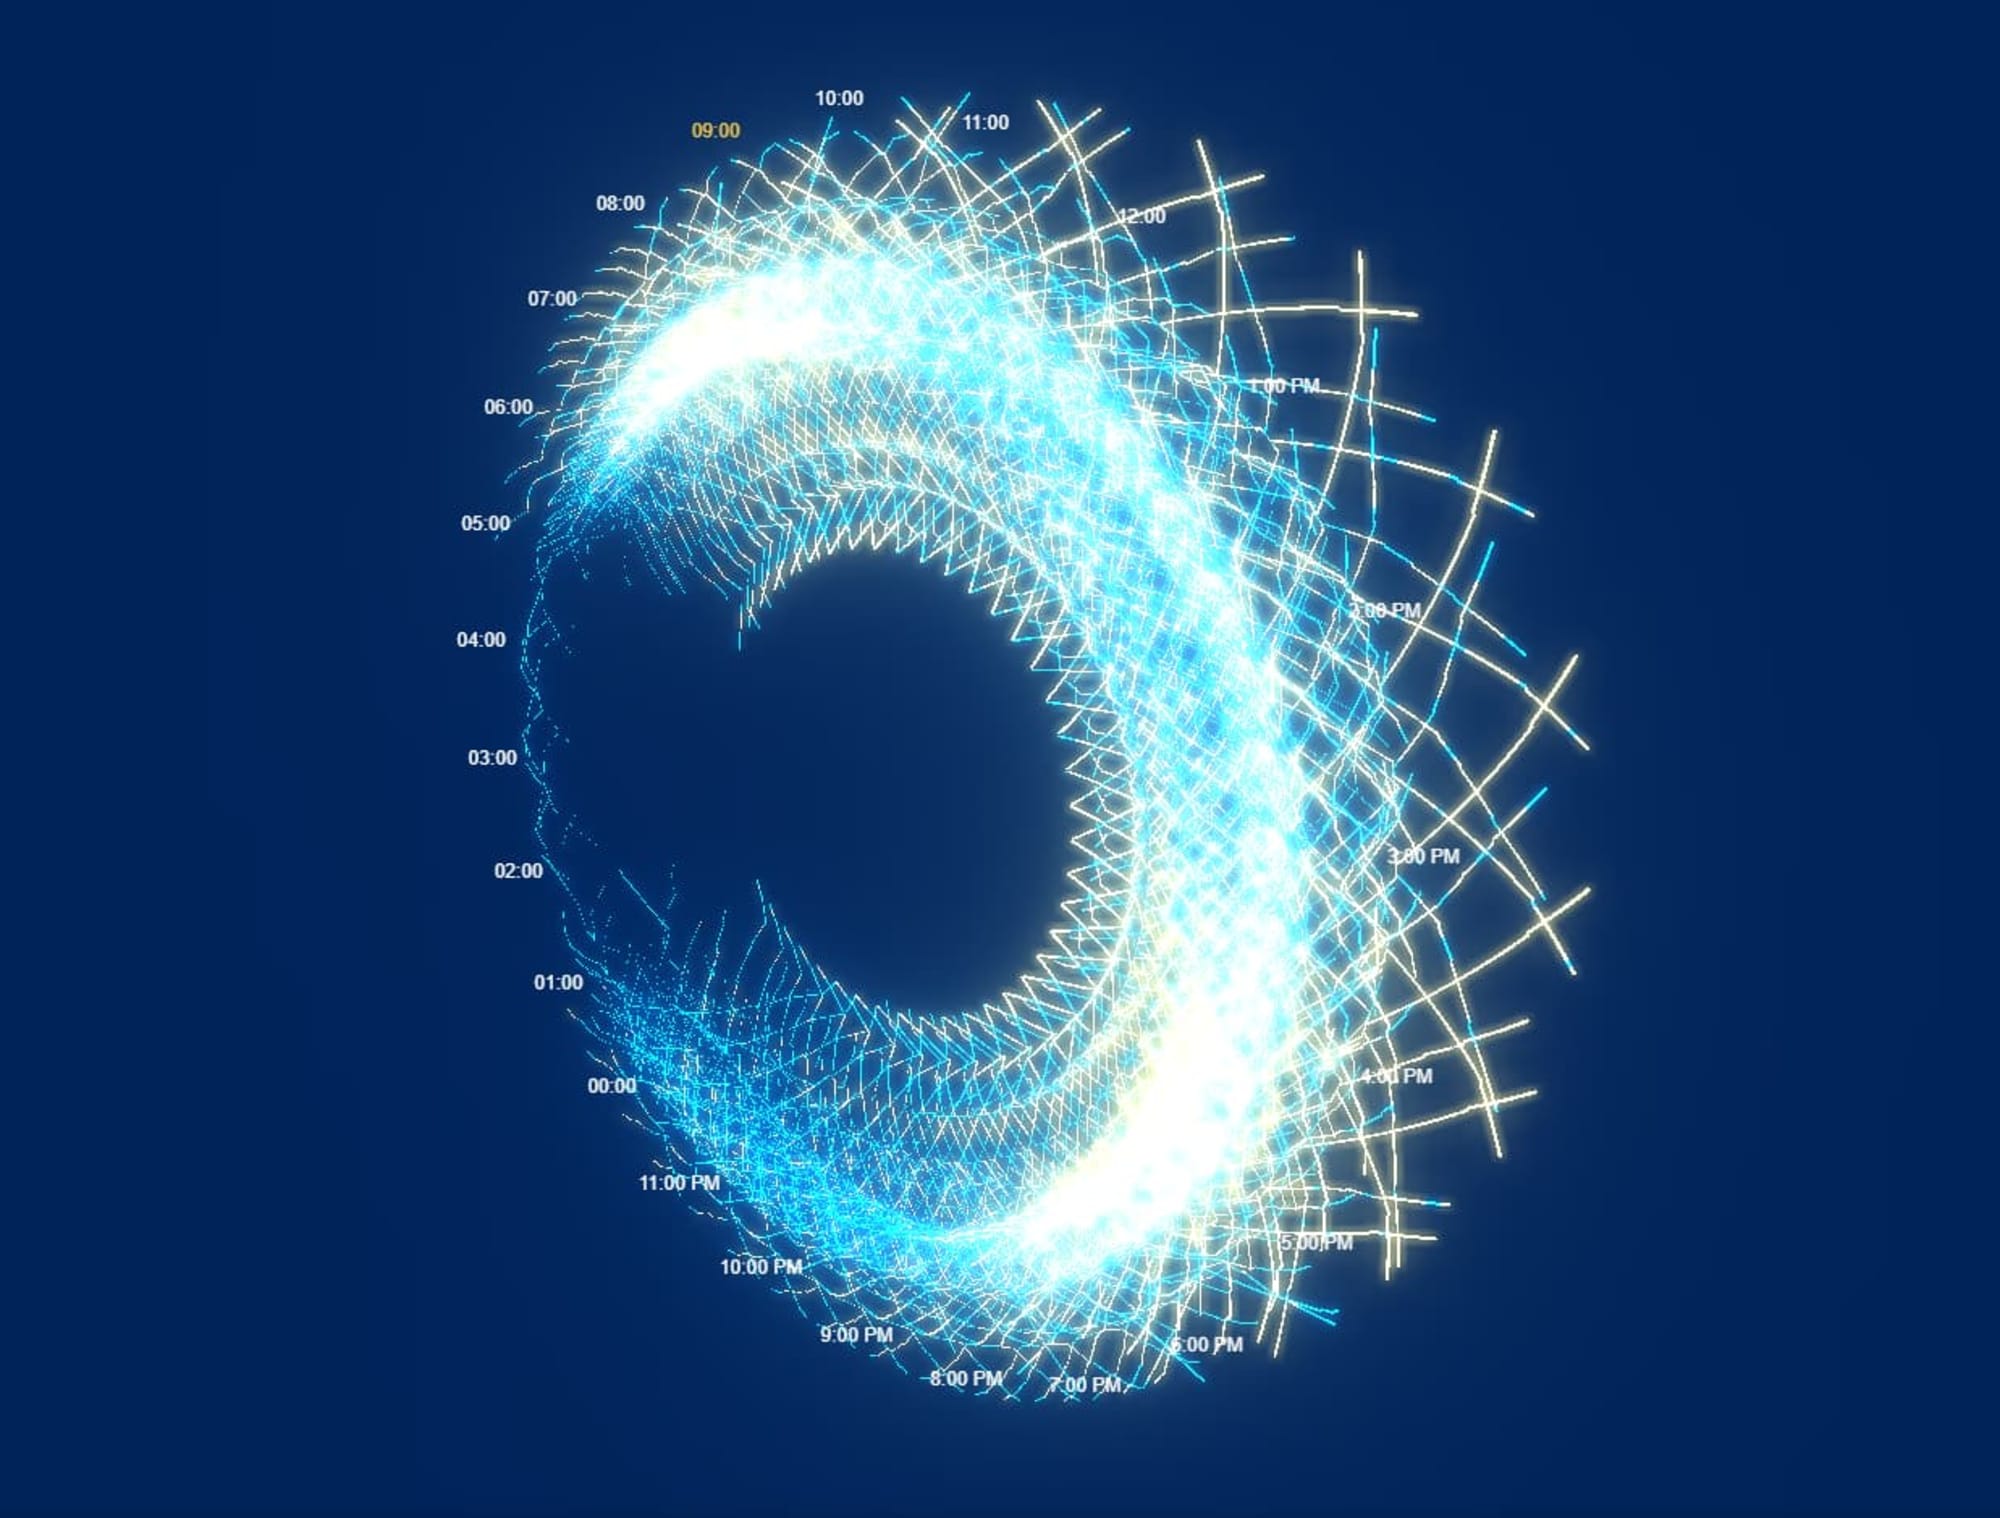
This visualisation by Jan Willem Tulp is a perfect example of thinking outside the box. It’s such a clever way of looking at temporal spatial data and visualising it in a way that lets you comprehend the spatial component while keeping the context of the historical, temporal component. Really great stuff. 👌
NS 2019
NS 2019
